

Protuner tuning methodology revealed.
Introduction by Michael Brown
Techmation has never previously published details of its patented Protuner tuning technology, which as far as I am aware is completely unique and not only uses the full frequency theory as postulated by the mathematicians, Nichols, Bode and Nyquist, who produced the feedback control mathematics in the 1930s, but it also uses expert rules to improve tuning response on particular types of process dynamics. It is a privilege to publish this world first in South African Instrumentation and Control. I personally have tested many tuning packages available on the market, and have yet to find another that can successfully perform tuning on any type of industrial process dynamics as successfully as the Protuner does.
In his early investigations into tuning Techmation president, Dave Ender, reached the conclusion that model-based tuning cannot work successfully in the real world, even with the most sophisticated model that one could construct. In the real world of process control, even the sophisticated and complex model as shown in the equation below may not be adequate to describe the real process. For example, the real process may be a ramp function as a response to a step input, as found in many process where mixing is done.

Ender decided that the only way to achieve ideal tuning was to be able to follow the basic frequency theory as closely as possible, but this requires dynamic operational testing by introducing oscillations at various frequencies into the process. Unfortunately one cannot test processes this way in real life for obvious reasons, quite apart from the tremendous time it would take. Therefore it was necessary to try and convert a step response taken in real-time into a proper full frequency response. Ender experimented with various methodologies including Fast Fourier and Z transforms, but eventually decided the only way to achieve the results he wanted was to perform a Laplace Transform digitally.
The Bode Plot obtained from the digital Laplace Transform will determine the exact Bode Plot of the process: then the tuning parameters can be found by combining the open loop Bode Plot with the Bode Plot of the controller to get the combined Bode Plot which determines the desired optimum tuning parameters for the controller.
In my next article, Case History 114 we will investigate how all this theory is put into practice by considering some real life examples with ‘as found’ tuning and then after optimisation with Protuner.
For now, let us focus on how Techmation achieved it.
Digital Laplace Transform of real test data
The Protuner Loop Analysis procedure allows users to determine the best response of the process variable to a step change in the controller output from which to find the optimum tuning parameters for the controller. Real processes are not always step-wise linear, but may have motion non-linearities such as dead band and hysteresis in the valve, and possibly non-linear installed characteristics. The Protuner allows the user to ‘window’ the test data that best identifies the process response that will provide the best and most robust tuning. When the real process variable contains excessive noise in the measurement, the software has an edit function that allows the user to draw through the noise to best describe the real response of the process variable and thus the true transfer function of the process upon which to base the tuning. If filtering is absolutely necessary, then the controller filter time constant must be found that best minimises the noise on the measurement. Protuner Loop Analysis then determines the optimum tuning for the controller based on this filter time constant. The Protuner was developed for testing and tuning real world processes and these features and functions give the user the tools to determine the process transfer function not only from perfect laboratory generated data, but also from test data recorded from processes in the real world.
At this point, let us discuss the methodology employed by Protuner Loop Analysis to determine the loop transfer function.
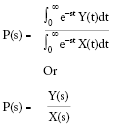
The Laplace Transform of a time domain equation is:
The Laplace transfer function of a process is the Laplace Transform of the output Y(s) (process variable response) divided by the Laplace Transform of the input X(s) (controller output), ie:
The time domain equations above {f(t)} and {Y(t) and X(t)} must be equations from time zero to time infinity so that the time domain equation can be converted into the Laplace domain. However, in step testing a real process we only have data from the beginning of the test to the end of the test, and not to infinity to describe both X(t) and Y(t).
Figure 1 is a step test with the following process transfer function
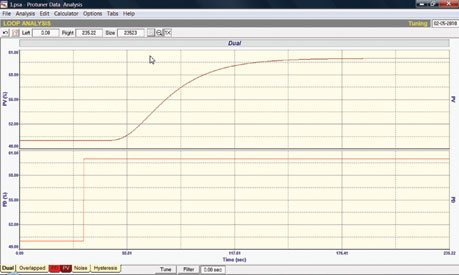
The graph shows a time domain plot of a multi-order process with a fifth order lag plus deadtime function, going from time zero to time 235,2 seconds and containing 23 523 points.
When a process is described as self-regulating the time domain equations X(t) and Y(t) can be written, in this case, as 23 522 point to point lines connecting the 23 523 points from the beginning of the test data to the end. The equation for a straight line from the end of the test data to infinity is then added to get two time domain equations from zero to infinity, made up of 23 523 individual equations.
Integrating the two continuous time domain equations from time zero to time infinity e-st we now have a Laplace transformation of the process of P(s) which exactly describes the real transfer function of the process. The Laplace transfer function is not like any standard function typically seen or written with the leads and lags described but nonetheless it is exact. However, in this form it is not really usable for tuning controllers.
The next step in the analysis is to make the data useful. The digital Laplace transform that describes the process contains the Laplace operator s. In fact it contains thousands of them. Substituting iω for the Laplace Operator s in Process Transfer Function:
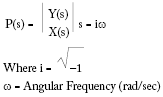
At this point we now have a process transfer function where the only unknown is the angular frequency ω. If we now separate all the real and imaginary components we have transfer functions in the format that follows, and the dynamic gain and phase shift are:
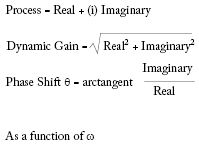
Dynamic gain and phase shift can now be plotted as a function of angular frequency in the well known Bode, Nichols, and Nyquist plot formats (Figure 2).
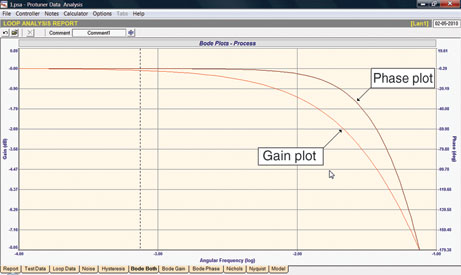
The question of how well the Bode Plot of the process as found using the digital Laplace Transform matches the Bode Plot of the actual fifth-order equation can be found by clicking on the Model tab and entering the real model time constants and over laying the Bode Plots (Figure 3).
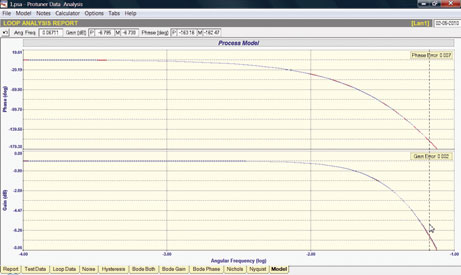
The single curser point shown at an angular frequency of 0,06711 radians per second found the model gain (M) and the process gain (P) both to be almost exactly -6,72 db. The phase shift of the process (P) was found to -163,2 degrees vs. the model (M) phase shift of -162,5 degrees. The model and process phase shift is not exact but very close. The slight difference in the phase shift between the process and the model is a function of sample rate at which the data is taken. However, for all practical purposes, the digital Laplace transformation of time domain data is an exact solution of the real test data.
Digital Laplace Transform of closed loop test data
Many eminent people have said that it is better to tune from closed loop data rather than open loop steps, but Techmation does not recommend this for reasons that will be discussed later. In actual fact though, the Protuner technology will work from either open or closed loop data as will be shown here.
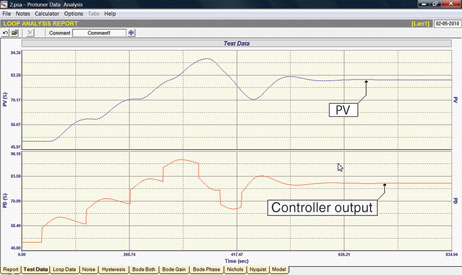
The data in Figure 4 is a closed loop response of the same transfer function used in the previous example to various setpoint changes. In this example, before the process reached steady-state a new setpoint change was made. In fact, seven setpoint changes were made before letting the process settle out at a new steady-state condition. The data was processed as before from the PV and controller output recordings as shown in Figure 5.

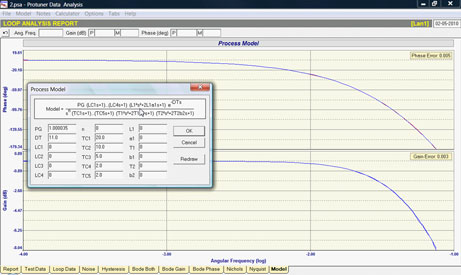
In this example the data is made up of 5880 points and therefore 5879 point to point lines from time zero to time 587,90 seconds with straight lines to time infinity. Since the digital Laplace Transform is simply the Laplace Transform of the input change (controller output) divided into the Laplace transform of the output (Process Variable response) one could reasonably expect the Protuner Bode Plot to be the same, and this in fact is achieved.
As shown in Figure 6 the Protuner Digital Laplace Transform of the closed loop time domain data determined almost exactly the same gain and phase shifts of the process at all frequencies.
Why does Techmation not recommend closed loop testing?
In the real world valves may have hysteresis plus deadband or simply stick when told to move, installed characteristics may not be linear, measurement signals are noisy, control loops can be interactive, and control strategies may be badly designed. These are only a few of the problems you may encounter. If the loop you are testing encounters such problems whilst performing under automatic control then the transfer function will not be correct, and thus neither will the tuning.
It is not that the Protuner Digital Laplace Transform methodology is incorrect. The test data is the culprit. Testing a system or loop with the Protuner is 90% trouble-shooting and learning how the process works and only 10% tuning. Open loop testing utilising the multistep procedure recommended by Techmation will help assure you that the data you are using to determine tuning truly represents the process you are trying to tune.

Michael Brown is a specialist in control loop optimisation, with many years of experience in process control instrumentation. His main activities are consulting, and teaching practical control loop analysis and optimisation. He gives training courses which can be held in clients’ plants, where students can have the added benefit of practising on live loops. His work takes him to plants all over South Africa, and also to other countries. He can be contacted at Michael Brown Control Engineering, +27(0)11 486 0567, [email protected], www.controlloop.co.za
| Email: | [email protected] |
| www: | www.controlloop.co.za |
| Articles: | More information and articles about Michael Brown Control Engineering |


© Technews Publishing (Pty) Ltd | All Rights Reserved
 printer friendly version