

Frequency analysis: auto and cross correlation.
Introduction by Michael Brown
I recently spent two days with Dave Ender of Techmation in Phoenix, Arizona. It was an arduous trip taking approximately 30 hours each way, but worth it in every respect. In my opinion Dave is undoubtedly the world’s leading expert on optimisation. He has a vast treasury of knowledge and experience and it is fascinating to listen to him, and hopefully also to learn a great deal from him.
In any event I was extremely fortunate to get a couple of articles from him which I thought would be great for publication in this magazine. This is one of them, dealing with the use of frequency analysis for use in loop optimisation – a subject about which most C&I practitioners have very little knowledge.
It should be noted that a lot of the conclusions that were gained by the frequency analyses that will be described in the article, could also be deduced by using other, possibly more arduous techniques, like measuring periods of cycles manually and experimentally finding ultimate periods. However the frequency analyses are simpler, easier and give more definitive information of the problems encountered.
Where does interaction arise?
Control systems are at times inherently complex and interactive. To optimise a system it is often both helpful and necessary to understand where disturbances in controlled variables are coming from. With knowledge into the interactive nature of a system you will be able to make the appropriate decisions on how to best optimise the system.
The purpose of this paper is to provide insight in how to use frequency analysis including power spectrum, auto correlation and cross correlation frequency plots; which should be available in any decent loop analysis package.
Figure 1 is a diagram of a simple pressure control system. One is wishing to optimise pressure control loop PIC-1322 which must control the pressure of the product being fed to a scrubber. The header manifold feeding this loop also feeds other plant systems. The analyser must be configured to record both the pressure control loop PIC-1322, and the header pressure PI-1286. The controller has already been tuned using the techniques described in a previous article, Case History 113.
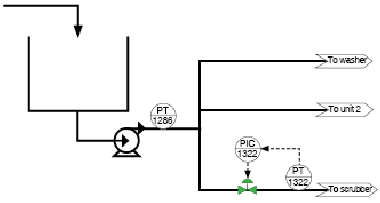
Figure 2 is a recording of a test which started with PIC-1322 initially in automatic, a little later it was switched into manual.
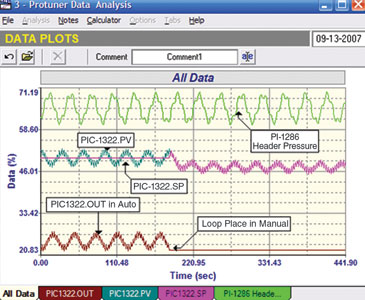
In examining the trend data it will first be seen that when the loop was placed in manual, the magnitude of the cycle in the loop PV got smaller. One will also notice that the header pressure is cycling. Frequency analysis plots can be used to better understand the disturbances to the loop that is to be optimised.
Frequency analysis of the system with the controller in automatic
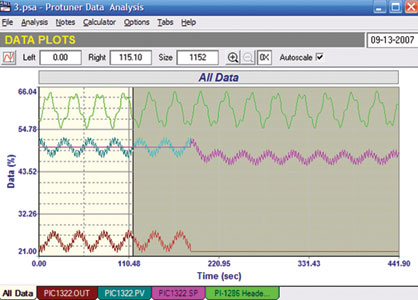
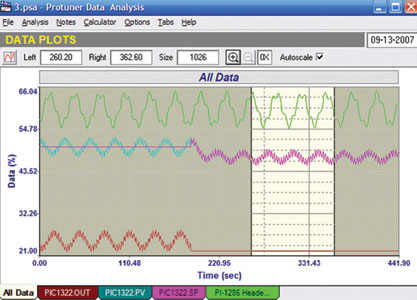
Frequency analysis will first be performed on PIC-1322.PV over the section where the controller is operating in auto. A window over this section is shown in Figure 3.
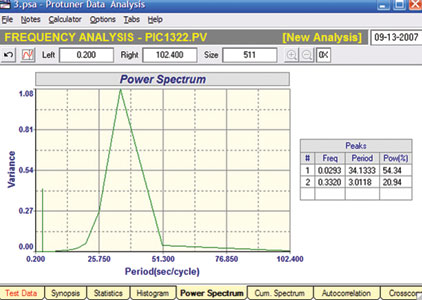
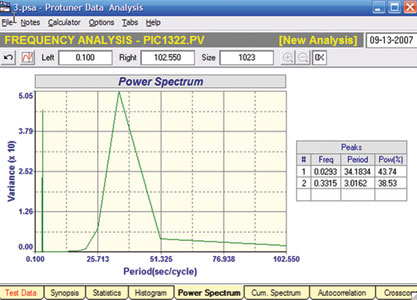
A power spectrum analysis is initially carried out over this section of the plot to determine frequencies existing in the disturbance. This is shown in Figure 4. It can be seen that two peaks are found which have periods of 34,1 and 3,01 seconds.
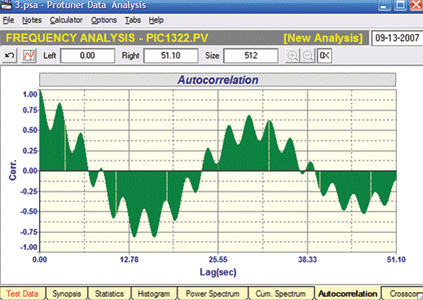
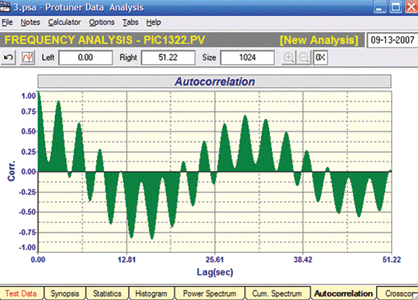
The next step is to run an auto correlation analysis as displayed in Figure 5. By using the cursor the peak to peak of the fast cycles will be found to be 3 seconds and the peak to peak lag time of the slow cycle 34 seconds. That information correlates with the power spectrum data in Figure 4.
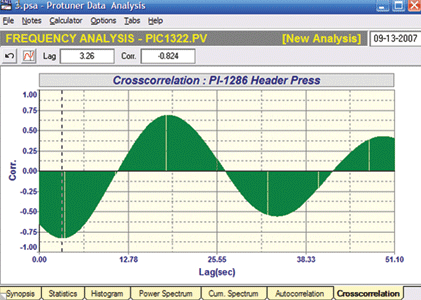
After this the PV data can be correlated with the header pressure data and a cross correlation frequency analysis is now performed. (Figure 6.) From the cursor point at the first peak, we find a lag of 3,26 seconds and a negative correlation of -0,824.This means that 82,4% of the variance in the PV comes from the load disturbance.
Frequency analysis of the system with the controller in manual
Similar analyses can also be performed over the section of the test with the controller in manual. A window over this section is shown in Figure 7 and the PV data is again selected for frequency analysis.
The power spectrum (Figure 8) again identified frequencies with 34 and 3 second periods but found that the power (magnitude of variance) was now 43,7% and 38,53% respectively. This compares with 54,34% and 20,94% power with the loop operating in manual. The auto correlation analysis over the same window (Figure 9) again gives the peak to peak lag time for the fast peaks as 3 seconds and the peak to peak lag time for the slow cycles as 34 seconds.
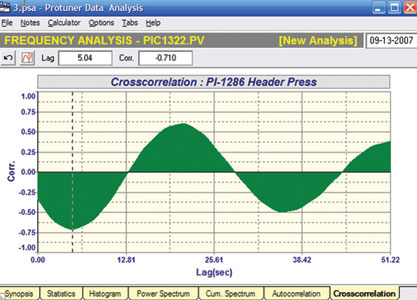
Cross correlation of PV and header pressure data with loop in manual (Figure 10) gives a first peak at a lag time of 5 seconds and a negative correlation of 0,710. Thus in manual, 71% of the variance in the PV can be directly correlated with the load disturbance in the header.
The difference in the automatic and manual cross correlations is the result of the closed loop operation of the controller magnifying or increasing the effects of the disturbance.
Conclusion
The frequency analysis plots are power tools to gain insight into both the frequency and sources of disturbances. In this example we found that 71% of the variance in the PV with the loop in manual can be directly correlated with the cyclic disturbance in the header pressure. Placing the loop in auto tends to amplify rather the variance in the pressure measurement being controlled.
The header pressure is thus identified as the major source of the variance in the controlled pressure. The next step would be to identify the source of the disturbance in the header pressure. Tuning the pressure loop is not the answer because faster tuning will only make the problem worse.

Michael Brown is a specialist in control loop optimisation, with many years of experience in process control instrumentation. His main activities are consulting, and teaching practical control loop analysis and optimisation. He gives training courses which can be held in clients’ plants, where students can have the added benefit of practising on live loops. His work takes him to plants all over South Africa, and also to other countries. He can be contacted at Michael Brown Control Engineering, +27(0)11 486 0567, [email protected], www.controlloop.co.za
| Email: | [email protected] |
| www: | www.controlloop.co.za |
| Articles: | More information and articles about Michael Brown Control Engineering |


© Technews Publishing (Pty) Ltd | All Rights Reserved
 printer friendly version