Bosch Capital works with CBSS to advance water quality monitoring tool
February 2021
News

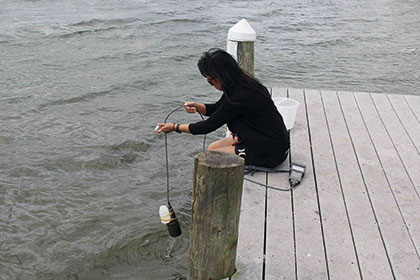
Bosch Capital has been appointed by environmental and water governance, risk and compliance specialist, CBSS, to support the commercial development of the new LEGUAAN Software-as-a-Service (SaaS) water quality monitoring, data visualisation and reporting tool. This project is supported by the WADER programme of the Water Research Commission.
CBSS has developed this water resource management tool to facilitate the efficient conversion of water monitoring data into meaningful visual graphs and reports that meet specific requirements of each organisation and that facilitate improved monitoring and compliance.
“In this exciting venture with CBSS, the Bosch Capital team is conducting a market analysis study that will inform the development of a commercial model and business plan for the LEGUAAN SaaS tool,” explains Rajiv Paladh, manager: Advisory and Funding at Bosch Capital. “This project also includes the development of a high-level financial model, to enable the analysis of the key financial drivers of the business.
“This study is crucial in assisting CBSS to ensure that LEGUAAN will offer an excellent value proposition to customers. The market analysis for this project is expected to be completed by the end of January 2021.”
The founding member of CBSS, Carin Bosman, had this to say regarding the monitoring tool: “We derived the name LEGUAAN from the South African water monitor, an agile reptile that plays an essential role in maintaining ecological balance in aquatic ecosystems. Key advantages of this cost-efficient system are time savings for the user, coupled with the assurance that all data is accurately converted into meaningful information and graphical representations.”
Without the correct interpretation of results, it is impossible to make informed decisions about the management adjustments that are necessary to improve consumption, reduce water footprint and minimise impacts on water quality, as well as reduce liability risks for the organisation.
Once the scientific integrity of the data is verified, it is swiftly converted into interactive and intelligible charts, such as Mauchino diagrams (salt balances including nitrates), time-series graphs, box-plot diagrams for statistical evaluations, and Ficklin graphs. Graphs and reports are provided online to users in a secure, interactive dashboard format, thus enabling users to download and present it to their internal and external stakeholders.
Reports and graphs generated by this water resource management tool can be set up to compare a user’s data to the limit values in the water-use licence, or any other site-specific limit value specified by a government agency. CBSS specialists are also able to assist with the development of scientifically correct, site-specific limit values in accordance with the new Department of Water and Sanitation policy on water quality management.
Further reading:
RS South Africa shapes future engineering talent
RS South Africa
News
RS South Africa is demonstrating that nurturing future engineers goes beyond traditional classrooms or competitions. On STEM Day, the company shone a light on the full spectrum of its educational initiatives.
Read more...
ABB and Compu-Power bring high-efficiency UPS innovation to IS3 X-Change 2025
News
ABB recently participated in the 31st annual IS
3X-Change 2025 in Cape Town, alongside its long-standing channel partner Compu-Power.
Read more...
UKZN’s SMART lab wins aviation award
News
: The SMART Lab at UKZN was awarded first place in the Aviation Research and Development category at the Civil Aviation Authority of South Africa’s award ceremony for outstanding contributions and achievements in the aviation sector.
Read more...
Meta and partners announce completion of 2Africa subsea cable system
News
Meta, in partnership with leading global and regional telecommunications companies, has announced the completion and activation of the core 2Africa subsea cable system. This marks a historic milestone in digital infrastructure, establishing what the world’s longest open-access subsea cable system.
Read more...
RS South Africa retains Level 2 B-BBEE status
RS South Africa
News
RS South Africa has once again achieved Level 2 B-BBEE verification.
Read more...
SEW-EURODRIVE unveils world class facility in Gqeberha
News
In a landmark event in the Eastern Cape attended by key customers and industry leaders, SEW-EURODRIVE officially opened its expanded state-of-the-art facility in Gqeberha, marking a major milestone in its strategy to strengthen regional support and deepen its footprint in the region.
Read more...
Africa’s brightest young battery innovators
Schneider Electric South Africa
News
Schneider Electric and Enactus, the international NGO dedicated to inspiring students through entrepreneurial action, have announced the winners of the 2025 Energy Transition Battery Innovation Challenge, funded by the Schneider Electric Foundation. It empowers young innovators to design battery solutions addressing the region’s most pressing energy challenges.
Read more...
Africa’s strategic role in powering the global clean energy future
News
The 2026 Africa Energy Indaba is to spotlight Africa’s mineral wealth, industrialisation potential and the urgent need for sustainable value chain development.
Read more...
The road to the Indaba
News
The Africa Automation Indaba 2026 is set to become a landmark gathering for Africa’s automation, process control and manufacturing community.
SA Instrumentation and Control will be running a dedicated editorial series spotlighting the voices, ideas and debates shaping Africa’s industrial future.
Read more...
Crash reconstruction tests advance vehicle safety research
News
The University of KwaZulu-Natal’s Scientific Multidisciplinary Advanced Research Technologies (SMART) Lab recently participated in a series of collaborative crash reconstruction tests held at the Toyota Test Track.
Read more...


