

The measurement of stack emissions at coal-fired power stations is of high importance to Eskom as exceeding the emission limits may result in the forced shutdown of generating units. These emission levels are imposed by legislation and must therefore be monitored and alarmed continuously.
To address the problem, system integrator Bytes Systems Integration used Wonderware solutions to implement a comprehensive emission monitoring system that is flexible enough to handle geographically-dispersed data sources while complying to various business rules. The result is a system helping to ensure the supply of electricity while minimising the impact on the environment.
The combustion of coal produces almost as much carbon emissions as the combustion of petroleum. What can we do about the more than two gigatons of carbon released into the atmosphere in the form of carbon dioxide every year? The answer is not much, unless the problem is treated at its source – exactly what Eskom has been doing for several decades. 95% of Eskom’s generating capacity comes from coal, and ash emissions from its coal-fired power stations have reduced by more than 90% since the early 1980s due to the installation of efficient pollution abatement technology and the decommissioning of older plants.
“Without treatment, we would be spewing concentrations of 30 000 to 60 000 mg of ash/normal cubic metre into the atmosphere,” says Dr. Kristy Ross, senior consultant at Eskom. “But with the use of abatement technology such as electrostatic precipitators or fabric filter plants, more than 99% of ash is removed from flue gas stream providing a particulate emission concentration of usually less than 200 mg/normal cubic metre.”
Getting legal
Every power station has an emissions licence with which it needs to comply. This ensures that the environment and health of people in the vicinity of power stations are not affected negatively. The emissions licence specifies two limits – a ‘normal’ operating limit, which emissions must be below for 96% of the time and a ‘cap’ limit, which emissions must never exceed. For example, Lethabo Power Station’s licence limits are:
* Normal limit: 75 mg/Nm³.
* Cap limit: 300 mg/Nm³.
* Grace period: 90 hours per stack (three units). Time given to rectify malfunctions such as poor quality coal, equipment breakdown, etc. The normal limit can be exceeded for this time, but emissions must remain below the cap limit.
Staying within these legal requirements, however, is not plain sailing. Because of the capacity shortage, shutdowns for maintenance or repair are reduced to a minimum, which means that equipment is not necessarily operating at maximum efficiency. Varying coal qualities and high load factors also contribute to the difficulty of complying with the legal emission limits.
“Under exceptional circumstances, where taking a unit off load would result in load-shedding, we ask the authorities for short-term exemption from the emission licence rules, usually from the normal limit,” says Ross.
The problem
Control room operators at power stations must keep a constant lookout for potential emission problems that might exceed the set legal limits. In the case of such an event, it might be necessary to exercise what is known as ‘load loss’ but this will have a ripple effect in that another power station will be required to take up the slack by ramping up its production.
The solution
“Given the scope of the problem and Eskom’s nation-wide footprint of 13 operational coal-fired power stations, it was decided that emission status should be centrally monitored and controlled in real-time from the Integrated Generation Control Centre at Megawatt Park,” explains Ross.
This would allow the information to be available remotely through a user-friendly interface so that environmental specialists could take the necessary action to control some complex processes. Top executives also needed access to this information via a web-interface. In short, the project goals were to:
* Prevent financial and production losses caused by forced outages.
* Prevent environmental degradation and fines from authorities due to exceeded emission limits.
* Deliver real-time KPI dashboards and reports.
* Give early warning alarms before emission limits are exceeded, enabling preventative measures to be implemented.
Solution selection
System Platform (ArchestrA) and certified system integrator Bytes Systems Integration were chosen for the project because of the company’s long-standing and successful relationship with Eskom, notably in the Enterprise Manufacturing Intelligence (EMI) field of which this project forms part.
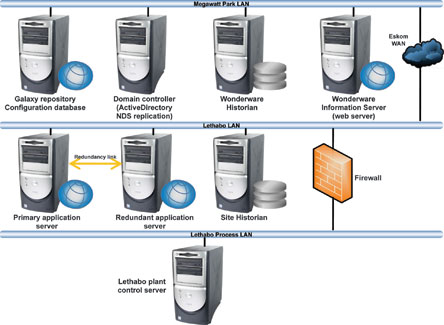
Due to its ease of integration with other initiatives and customisation capabilities as well as its scalability, Bytes would use the existing Wonderware infrastructure consisting of System Platform (ArchestrA), Historian, Historian Client (ActiveFactory), InTouch (Scada/HMI), Information Server and Alarm Provider.
Implementation
Figure 1 shows the interaction necessary between all the players. Aggregated hourly averages from each power station are sent to Megawatt Park where the necessary operational decisions are made.
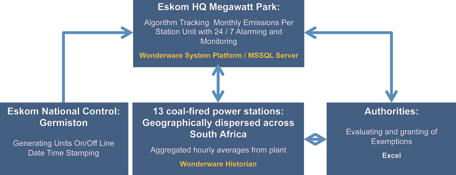
Machiel Engelbrecht of Bytes explains: “For example, during start-up, a unit’s emissions will be higher than during normal operation. So it is important to know when a unit is about to come on line, how long it was off and how long the higher emission level is likely to last. This helps apply for the necessary exemption from the authorities. In addition, the information supplied places Megawatt Park in a good position to initiate preventative measures and to ensure optimal load distribution in the event of a shutdown due to excessive emissions.”
The geographically-dispersed historians are used as the base for real-time information and this is then compared to targets, plans and projections from other transactional systems such as information supplied by National Control (Simmerpan - Germiston).
Trending information is required to monitor the emission levels over certain time periods and this is done with ActiveFactory. Aspects of the Wonderware Historian Client are also used to calculate the hourly time-weighted averages.
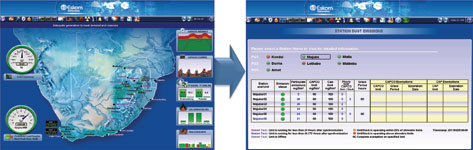
Wonderware’s Information Server is used to distribute data and information where it can be monitored from any client workstation. A single dashboard for each thermal power station was developed showing hourly emission values together with their specific limits and for how long the normal limit was exceeded. Additionally any applicable exemptions to the limits are also shown and the system adapts automatically. Early warnings are raised when the emission values get within 20% of the acceptable limits where the right decision can be made to prevent penalties and unit shutdowns. A simplified robot on the dashboard gives a quick overview of the stations’ status from where the user can drill down to more detailed information.
The first three power stations’ emission monitoring was delivered within a month. This was followed by training of head office’s control centre operators, environmental consultants, managers and station personnel.
Bytes enlisted the help of environmental specialists from Eskom to provide scenarios and business rules. They also interacted with various system owners within the organisation for access to data. All the development and tests were done on a live system. “The end-user was helpful by entering manual data such as exemption information, in parallel to their existing process,” says Engelbrecht. “This speeded up delivery as all values could be verified in real-time. Excel was used as an input form for the operators at the stations as it is a product with which they are familiar. We used MSSQL to extract the time-weighted hourly averages from the Wonderware Historian.”
The main beneficiaries of the system’s information are senior consultants from Environmental Management who generate reports for the authorities. Other beneficiaries include top executives and head office Generation Control Centre personnel, especially those involved with the early warning system which involves risk and strategic analysis.
The system is integrated with the legal documentation of the authorities and client. It is also integrated with a number of other transactional and web-based systems within the business infrastructure.
Benefits
* Weekly reports are now supplemented with hourly monitoring – no more ‘after the fact’ initiatives.
* Early warnings of possible forced load losses allows for pro-active decision making.
* Real-time KPI dashboards and reports present a window on reality rather than history.
* 24 Hour monitoring and alarming.
* Enables preventative measures to be implemented – early detection of trends is crucial to minimising downtimes.
* Ensures compliance with emissions licence – elimination of environmental degradation and fines as far as possible.
* Real-time monitoring of plant performance identifies symptoms of potential problems before they affect service delivery.
Conclusion
Eskom’s vast resources literally run South Africa. Many people do not fully understand the consequences of not having them. Quite simply, Eskom is responsible for the way we run our lives and it is encouraging to see the steps the company is taking to ensure the continuity of that way of life.
So, the next time you experience a blackout, it may not be due to insufficient generating capacity – but to ash! Thankfully, that particular source of annoyance is being minimised rapidly through Eskom’s proactive initiatives.
For more information contact Jaco Markwat, Wonderware Southern Africa, 0861 WONDER, [email protected], www.wonderware.co.za


© Technews Publishing (Pty) Ltd | All Rights Reserved
 printer friendly version