



Feedback theory generally assumes that the process has a linear transfer function. Essentially this means that the transfer equation describing the process is linear, which means that equal changes on the input will result in equal changes on the output. (Note: the magnitudes of the changes of the input and output steps themselves may be different as this is dependent on the process gain).
Figure 1 illustrates a simple open loop test on a simple self-regulating process to ascertain if the process has got what is known as a ‘linear installed characteristic’. Several equal steps are made on the PD and the responses on the PV studied. If the magnitudes of the output steps are equal then the process has a linear installed characteristic. If the magnitude of the steps changes as the measurement moves over the range, then the installed characteristic is non-linear. Both types of response are illustrated in Figure 1.
Why is linearity important?
The answer lies in the fact that, as mentioned in the earlier article on process gain, the tuning of the controller’s P term is largely dependent on the process gain. If the process has not got installed linearity, then this would mean that the tuning would only be good at the one place on the measuring range where the particular process gain was used in the tuning calculation. At other places where the process gain was smaller, the control response would be more sluggish, and where it was bigger, the response would be faster and more cyclic, and could in fact even become unstable.
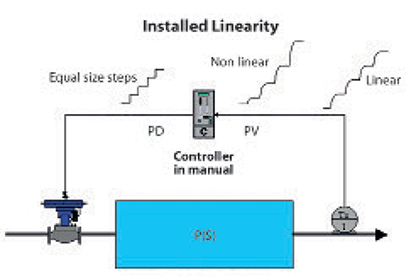
Non-linearity can occur in any of the different elements making up the control loop. There can be non-linearity in the measuring system, in the process itself, in the controller (although as the controller is in manual here, this will not affect the test under discussion), and in the final control element itself. Let us assume for the present case that the measuring system, process and controller are all linear. If this is so, then the final control element must also display an installed linear characteristic of its position versus the flow through it, if we want the whole process to be linear.
Figure 2 illustrates two specific types of common inherent valve characteristics, linear and equal percentage. (There are also other relatively common characteristic curves available.) People are very often confused as to why one doesn’t always just use an inherent linear characteristic. After all, the graph shows a straight line relationship between flow through the valve, and valve stem position.
To answer why this is not necessarily true, one must understand how the inherent characteristics are generated. The test performed by the manufacturer to generate the curve is accomplished by placing the valve in a flow rig which is arranged so that the valve has a completely constant differential pressure across it at all times.
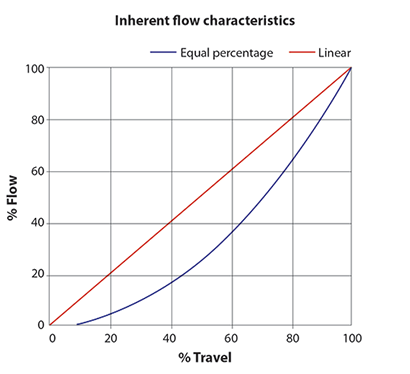
However, in real life situations, the valve may be, and often is, installed in a pipework configuration where the differential pressure across it can vary as the flow through it changes. Bearing in mind that a valve can be thought of as a ‘variable orifice’, and from Bernoulli’s theorem we know that the flow through an orifice is (amongst other factors) proportional to the square root of the differential pressure across it; therefore, where the differential pressure across the valve is free to change, the installed valve characteristic is far from linear. To counteract this, the valve manufacturers offer a characteristic called ‘equal percentage’, where the percentage increase in stem position equals the percentage increase in flow. This can be roughly thought of as a mechanical square root extractor, which will result in a linear installed characteristic.
There are, as mentioned, many other characteristic curves available as standard; quick opening is another example. The next question is: How do people know what characteristics to employ when installing valves? The answer is that usually there is no easy way. Valve characteristics are generally chosen from either past experience, or by guesswork. If a person has worked on similar processes before, they will have a very good idea of the correct characteristic. There are also many articles published on how to choose the right characteristic. Most of these fall in the category called SWAG, a wonderful acronym coined by an American control journalist some years ago. It stands for ‘Scientific Wild Ass Guess’.
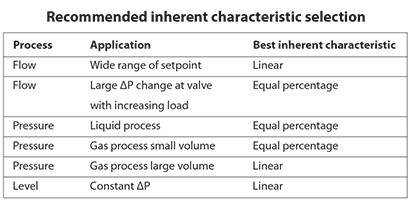
To illustrate this point, take the table given in Figure 3. It is a summary of recommendations for choosing the right characteristic, taken from a valve manufacturer’s handbook. The only recommendation in it that really makes sense to me is the last one, where you will generally use a linear inherent characteristic on level applications because in most such cases, you have constant differential pressure across the valve. It is necessary then to check that your valves do in fact have installed linearity. In about 35% of cases we find installed non-linearity, but this is often very much dependent on particular plants.
When to linearise
If we do find installed non-linearity on a control loop, is it really important to linearise it? The answer depends on factors such as: How important is the control? Can you afford instability or sluggishness? And finally, what is the control actually doing in reality?
This last question is relatively important. Many loops are only there to deal with minor load changes, the set-point is never varied, and the measurement doesn’t move around wildly. In such cases, the non-linearity will not affect things much. However, in cases where the loop works hard and the measurement may move all over the place, for example a secondary cascade loop, it will be very advantageous to linearise the characteristics in order to get optimum control over the entire range.
Common methods of linearising installed characteristics are:
1. Change the valve trim.
2. Install a positioner cam that has the mirror image of the installed characteristic.
3. Use an X-Y table or a curve shaping facility in either the controller’s output, or preferably in the positioner, if such a facility is available. (Note: If the linearisation is done in the controller’s output, you must be careful when performing tests, as the actual controller’s output is the true PD, and the PD signal coming out on the terminals of the control system where you may be measuring is now characterised.)
About Michael Brown

Michael Brown is a specialist in control loop optimisation with many years of experience in process control instrumentation. His main activities are consulting, and teaching practical control loop analysis and optimisation. He gives training courses which can be held in clients’ plants, where students can have the added benefit of practising on live loops. His work takes him to plants all over South Africa and also to other countries. He can be contacted at Michael Brown Control Engineering CC,
| Email: | michael.brown@mweb.co.za |
| www: | www.controlloop.co.za |
| Articles: | More information and articles about Michael Brown Control Engineering |






© Technews Publishing (Pty) Ltd | All Rights Reserved
 printer friendly version