
The OEE metric has been applied within most industries in the past few years. As a metric, it makes perfect sense and it has assisted some companies to improve their operations considerably. It has been so successful that most manufacturing operations management (MOM) software vendors have an 'OEE calculator' as part of the product offering. OEE however does have a specific 'sweet spot' and that is discreet manufacturing and packaging lines. Here throughput, quality and machine availability have a direct impact on the profitability of the production line and can be measured in real-time. In some other industries, the OEE calculation needs to be modified and distorted to such a degree that it becomes almost unrecognisable.
The issue with OEE
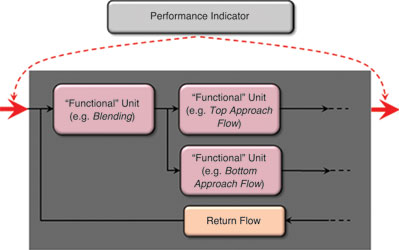
OEE is a great metric where individual good and bad quality production units can be counted easily through a specific production line (typical to discrete manufacturing and packaging). OEE presents, however, limitations when applied to continuous processes. Figure 1 illustrates that OEE typically attempts to report performance across multiple ‘functional’ units of a continuous process. The units are effectively all placed in a ‘black box’ and OEE is measured across the positions signified by the red arrows (similar approach used in discreet industries where OEE is measured only on the ‘constraint’ in the process). It is thus unable to measure these units individually.

The specific issues with OEE are as a result of continuous process industry design principles and production philosophies. Such plants are designed for instance to have parallel processing (for instance distillation columns) or process lines that split and then merge again later in the process (for instance for different size distributions of the same material). A simple example is shown in Figure 1.
These plants are also sometimes designed such that some of the critical equipment in the process has a backup in case of breakdown or other non-availability. It is also quite normal for continuous processes to have buffer storage areas or tanks between dependent processes, so that minimal process disruption occurs when equipment breaks down. In a lot of these continuous processes the optimum throughput is not a static number based on the product being manufactured, but rather a dynamic number that changes depending on the feed quality of one or more raw materials. Due to the continuous nature of the process, the buffer design and the spare capacity (outside the bottleneck) of the process, it is possible that some whole sections of the plant can be shut down for a period of time without affecting the overall plant throughput.
In measuring product quality, it is also not as straight-forward, as one cannot just install a counter to count good and bad quality, but the output typically has to go to a laboratory and the result is only available one or two days later. Most OEE calculators struggle to accommodate late quality data. For some process industries, having a product quality from the process say at 99.90% purity is actually bad for business if the minimum acceptable purity is 99.00%
As result of the above issues, it is difficult if not impossible to determine the optimum throughput, the actual plant availability and the real product quality within a continuous process plant.
On average, OEE correlates to financial performance but fails to facilitate effective management of the individual units. OEE also only works for individual lines, it cannot be rolled up to (or averaged to) for instance Area level (as defined by the ISA-88 and ISA-95 standards) as it becomes a meaningless measure.
A new metric for continuous processes
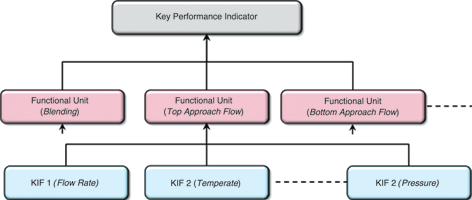
What is required for continuous industries is a metric that takes into account the specific issues related to processes that are not necessarily related to a specific availability, throughput or quality. This metric should rather be aimed at the quality of control related to factors influencing for instance yield and recovery, such as feed quality, process parameters, reaction times and recycle ratios. In the absence of this specific metric, most continuous plants use breakdown data (mostly for tracking for breakdown reasons), total plant throughput and assume 100% quality to determine a performance metric (OEE). Figure 2 illustrates that performance of a continuous process is a function of multiple units’ performance against specific process variables (key influencing factors).

Those continuous plants that do actually attempt to calculate an OEE in most cases have distorted the metric to such a degree, with so many additional rules, that it does not bear any resemblance to the OEE metric calculated for discreet industries. For instance, only if a process is off-line for more than three hours does it influence the down-stream process and as such should be classified as ‘Not Available’ only if downstream buffer tanks are below 10% full and then throughput below the theoretical is counted as ‘Reduced Speed or Throughput Loss’.
So if the normal OEE metric does not work or is ineffective for process industries, what metric should be used in its place? MESA International is currently working on the development and review of a metric that takes into account the specific issues related to continuous industries. This metric would be used to determine the time a process is in a finite state as defined in the draft ISA-106 standard – Procedure Automation for Continuous Process Operations.
Time in State Metric for continuous processes
The Time in State Metric (TISM) takes into account all the issues raised previously for continuous process industries. The metric does not look at throughput in isolation, but it looks at throughput in relation to those factors in the process that influence the yield, quality and equipment availability. This is done at unit level (as per ISA95 definition). For example, the Time-in-State Metric is reported for Blending, Top Approach Flow and Bottom Approach Flow individually (refer to Figure 1 and Figure 2).
The TISM principle is that units must be controlled in an optimum state. A unit’s optimum state depends on various factors within the process such as feed quality, feed rate, recycle ratios and a range of process measurements that can influence the performance of the specific unit. This optimum state can change frequently and without prior planning or warning. The TISM is thus a dynamic measure that makes provision for the changing nature of the process and/or changes to the business strategy and objectives.
The optimum state can take many forms, depending on the strategy and state of the influencing process variables at a specific point in time. For instance, the business objective may be to maximise production throughput while sugar cane supply is abundant. As soon as the supply reduces, the objective may change to maximise sucrose extraction. This calls for different ‘ideal’ operating conditions on individual units e.g. different residence time in the diffuser chambers, different temperature profiles, and/or water flow rates).
In addition, the TISM can be rolled up to Production Unit or even Area level, depending on the actual inter-connectivity and relationships between Units and Production Units within Areas (as defined by ISA-95).
So what does the TISM actually measure?
The TISM looks at a specific Unit or Production Unit and measures the actual time the unit is within the optimum/ideal state, where ideal state can be associated with high efficiency, reliability, stability, predictability, yield, etc.
This amount of time is then expressed as a percentage over any specified period. Figure 3 shows the intervals between April 2012 and May 2012 when this specific unit was within a defined optimum state. In this period, the unit spent only 19% of time within the optimum state and so the TISM for this unit for this period would be 19%. Case studies have shown that process units spend typically only around 20% to 40% of time within the optimum state.

TISM reports the performance of individuals units and can be rolled up to report performance at Production Unit and/or Area level. When rolled up, the TISM value reports the time that ALL units remained in ideal state at the same time.
For instance, if the output from ‘Blending Unit’ is not within the ideal parameters, ‘Top Approach Flow Unit’ can still be controlled within an optimum state given the specific input. However, this optimum state (for the specific circumstance) for ‘Top Approach Flow Unit’ may be sub-optimal for the area as a whole. Only when ALL units are in an optimum state at the same time will the whole area operate in an optimum state.
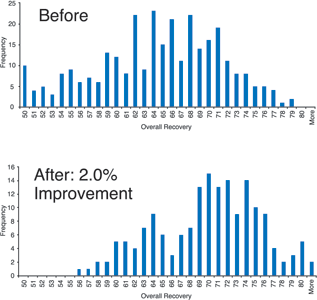
The rationale for this is that within continuous industries, the output from one unit, e.g. Blending, is typically the input into the next unit e.g. Top Approach Flow. Also, operational personnel have direct control over individual units i.e. process parameters can be adjusted to effect the state of the specific unit. The objective for operational personnel is to manage each unit within its ideal state using TISM – in other words, maximise the ‘time in ideal state’. Managing each unit in the ideal state will, by default, contribute towards realising overall performance. Figure 4 illustrates how improving the TISM by 2% contributed toward increasing recovery in a metallurgical beneficiation process.

TISM is applied to production process monitoring as well as equipment performance monitoring. These two TISM values can then be reported together to ensure that a balance is being maintained between operating the plant/area/unit in an optimum production state and ensuring that the process is controlled in such a way as not to wear equipment down.
Flexibility exists to also deploy TISM for energy efficiency, environmental condition, operating cost and/or quality management, amongst others.
Conclusion
Measuring the time-in-state for continuous processes as opposed to OEE will for the most part be a far more useful metric for both plant personnel and management as it takes into account the changing nature of continuous processes and the effective reaction to adverse factors influencing the process.
For more information contact Gerhard Greeff, Bytes Systems Integration, +27 (0)82 654 0290, [email protected], www.bytessi.co.za

© Technews Publishing (Pty) Ltd | All Rights Reserved