

Many manufacturing companies have been measuring the efficiency of their lines and work cells in such a way as to 'mask' many of the causes of lost efficiency. Over a period of years, management focuses on the numbers being reported and is no longer thinking about what is included or excluded from those measurements. One of the reasons OEE (overall equipment effectiveness) is such a valuable measurement, is that it allows one to look at all sources of lost time and lost production. So OEE has emerged as the leading approach for accurately measuring the true productivity of plants.
What is OEE?
By definition, OEE is the product of availability, performance and quality percentages: OEE = availability x performance x quality where:
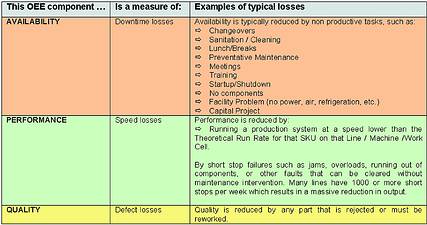
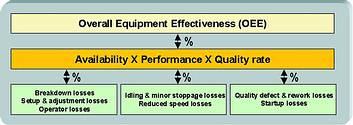
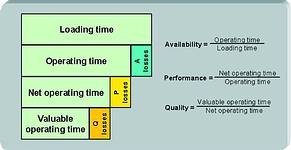
Each one of these OEE components represents losses that result in loss of productive operating time. We begin with total available time and subtract time lost to availability (downtime), performance (speed), and quality (reject/rework) issues. Very quickly, one can see the effects of these losses on production time. Clearly, the productive time becomes a fraction of total available time. By using OEE and understanding all of our losses, we can take the actions necessary to increase the productive time as much as possible. Figure 1 illustrates the time losses due to various OEE categories.
Automated calculation of OEE
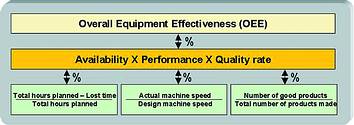
With modern software tools, the information available in the PLCs can be used to produce sophisticated realtime reports that allow manufacturers to fully understand all of their sources of lost productivity and to motivate the plant team to continually optimise OEE. Figure 2 provides an example of the types of reports that can be generated by these systems.
Back-of-the-envelope calculation of OEE
Given that many manufacturing companies believe they are running at an efficiency of 85 to 90% (which is true, the way they currently measure efficiency), it is very helpful to get an idea of the true potential for improvement by performing a rough back-of-the-envelope calculation of the current OEE. This calculation will lack the detail (breakdown of availability, performance and quality and the detailed reasons behind all the stoppages) but it will provide a good idea of where your production lines really stand at the moment. This back-of-the-envelope calculation is astoundingly easy to perform. The thought process is described in Figure 2 and the table in Figure 3 is provided as an example.
Small OEE improvements can generate huge business opportunities.
Let us extend the example of our canned food plant. Let us say that the plant had an initial OEE of 66,5% prior to implementing an automated OEE and downtime measurement system and an improvement initiative.
* By reducing set-up times (small investments in tooling, establishing best practices and training) the availability improves from 80% to 85%.
* By identifying and resolving the five most serious causes of short stops, the performance improves from 84% to 86%.
* By identifying the number one cause of rejects and resolving it, the quality improves from 99,0 to 99,2%.
* Compounded, these small improvements have the net effect of improving the OEE from 66,5% to 72,5% - see Figure 4.
Improving OEE by 6% means a 9% improvement over the original value and therefore the line can produce 9% more product in the same production time or, if more capacity is not needed, then the production schedule can be cut back by 9%. In a plant that is operating 24x7x350 days, this allows the reduction of 95 shifts per year, or the second and third shift on nearly every Sunday.
Many companies routinely hit capacity constraints, and immediately consider adding overtime for existing workers, hiring workers for a new shift, or buying a new line. Relatively few companies have made the more modest investment that is required to optimise the performance of their existing lines. This investment pays huge dividends by reducing process variability, reducing changeover times, improving operator performance, reducing overtime expenditures, unleashing hidden capacity, and allowing deferral of major capital investments. These are measurable benefits that will substantially improve the bottom line of your production operation.
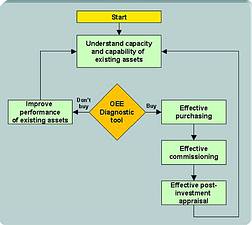
"OEE has become the crucial link between the financial and operational performance of production assets," says le Plastrier. "In South Africa, top management is becoming increasingly aware that the DT Analyst realtime OEE solution from Wonderware can positively influence their bottom lines more profoundly and more quickly than almost any other attempt at improving production efficiency. DT Analyst is becoming the diagnostic tool that is giving managers the control they have been looking for over the utilisation of their production assets."
For more information contact Mike le Plastrier, Futuristix Advanced Control Systems, 011 723 9900, [email protected], www.futuristix.co.za

"DT Analyst is helping DMS Powders map cause and effect scenarios and to detect the root cause of problems at many levels. It has proved to be a powerful diagnostic and decision support tool which, together with SuiteVoyager (Wonderware's Web portal), is a permanent member of our daily production meetings." - Piet van der Merwe, ABB Automation Specialist at DMS (Dense Media Separators) Powders in Meyerton. DMS is a business unit of Samancor Manganese (a division of the BHP Billiton Group).


© Technews Publishing (Pty) Ltd | All Rights Reserved
 printer friendly version