Sophisticated water network analysis
April 2001
Analytical Instrumentation & Environmental Monitoring
Increased profitability usually starts with an increase in efficient application of resources. Using a single set of demand parameters for designing a water network will not produce optimum results. Rather, analysis and design through a complete cycle must be performed using realistic demands.
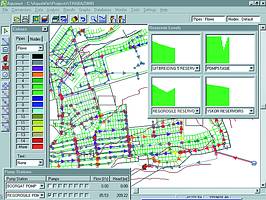
Portion of the Thabazimbi model during the analysis process
Aquanet, the water network analysis program supplied by Allyson Lawless, has recently been extended to allow modelling over a 52-week cycle. This means that a daily demand pattern per 15 min increments, a weekly demand pattern by day and an annual demand pattern by week may be entered into the demand pattern menu.
Aquanet is a highly interactive graphics design application running stand-alone or on Civil Designer and AutoCAD 2000 using Microsoft Access for storing the data. The application allows for time simulation, taking daily demand patterns as well as seasonal peak factors into account. When up and running, the true consumption will be compared to the theoretical model by means of linking the design and financial databases containing field readings. This will allow refining of the theoretical model for picking up possible bursts or problem areas at a glance. This ability to link databases to the network model allows for GIS type reporting and will be used as a management tool.
Aquanet boasts various methods of creating a network, eg DXF import, ASCII file import, other software file imports as well as the ability of calling up background bitmaps or DXF drawings. Using the friendly graphical interface to model the network within Aquanet, it also uses AutoCAD 3D faces or lines or 3D DXF DTM files from other software packages to interpolate ground elevations.
The software uses the powerful and tightly integrated functions of Civil Designer to load Allycad, AutoCAD and Caddie drawings, large raster images and DTMs. This allows all services to be modelled on one DTM creating one drawing showing all services, allowing clashes to be detected between services. Aquanet uses the fast and easy to use CAD functions to import the layout and whatever intelligence available on the drawing such as draw-offs, levels, diameters, etc. The positions of valves, pump stations and reservoirs may also be established from the symbols on the CAD layouts.
On-screen graphic functions allow the user to generate pipes, nodes, pump stations, valves, reservoirs, pressure release chambers, insert nodes, join pipes, insert bends, make connections, or delete pipes, nodes and fittings. When the pipe geometry has been defined, attributes may be assigned using various methods. A comprehensive range of pipe materials, valve and pump curve tables are available for selection.
During the analysis, pumps and valves may be seen kicking in or switching off depending on pressure, flow or level conditions, and time controls. Reservoirs filling and emptying are also very clearly presented graphically during the simulation process. Colour graphics of the head losses, pressures, flows, pipe sizes are produced to assist with decision making on an optimal solution.
The Aquanet product is being developed further to cover the whole workflow in water management. Future developments will include a costing module, telemetry data links, optimisation module, and more. Road, sewer, stormwater or water design will be done simply by switching between modules that run within one interface.
With these ongoing developments and future plans, Aquanet is becoming an indispensable tool for water networks modelling, design and maintenance. Being a local product, data adaptations to the local market demands are assured.
Allyson Lawless
(011) 476 4100
[email protected]
www.ally.co.za
Further reading:
Importance of gas analysis in the petrochemical industry
Elemental Analytics
Analytical Instrumentation & Environmental Monitoring
Gas analysis plays a critical role in petrochemical operations, supporting process optimisation, product quality and plant safety. As an experienced and expert gas analysis supplier, Elemental Analytics can provide the correct analyser and sample system package to meet individual plant requirements.
Read more...
Fully integrated standalone thunderstorm warning system
Senseca
Sensors & Transducers Analytical Instrumentation & Environmental Monitoring
Senseca South Africa has introduced its BTD-1 fully integrated, standalone thunderstorm warning system, which detects lightning by monitoring the background quasi-electrostatic field. The system can generate alerts before the first lightning strike, with a detection raterange of up to 83 km.
Read more...
Environmental monitoring with testo Saveris 1
Analytical Instrumentation & Environmental Monitoring
The testo Saveris 1 environmental monitoring system has been in continuous use since 2010 at Jungbunzlauer, a biotechnology company in Germany, providing seamless temperature and humidity data for audit-ready, GxP-compliant processes across laboratories, warehouses and production areas.
Read more...
Reliability restored through systemic vibration analysis
Wearcheck
Analytical Instrumentation & Environmental Monitoring
Condition monitoring specialist, WearCheck uses a variety of testing techniques to enhance reliability in machinery components and prevent failures.
Read more...
Meteorological data logger with up to 32 analogue sensors
Senseca
Analytical Instrumentation & Environmental Monitoring
Senseca has introduced its advanced data acquisition system for environmental monitoring, which has a universal data logger for up to 32 analogue, pulse and smart digital sensors.
Read more...
Yokogawa’s free chlorine analyser is gold standard for water treatment utilities
Yokogawa South Africa
Analytical Instrumentation & Environmental Monitoring
One of the key factors in ensuring safe drinking water is the accurate monitoring of free chlorine residuals. This is where advanced online analysers, such as Yokogawa’s FC800 free chlorine analyser, are becoming increasingly valuable for water treatment operators and municipal utilities.
Read more...
Cooling tower bleed control
Analytical Instrumentation & Environmental Monitoring
Cooling towers rely on evaporation to remove heat, but this process also concentrates dissolved solids in the system. Left unmanaged, this buildup can lead to scaling, corrosion and fouling, reducing efficiency and increasing maintenance costs.
Read more...
Expanded test laboratory provides polymer users with more information
igus
Analytical Instrumentation & Environmental Monitoring
igus has expanded its international testing facilities to accommodate its increasing product portfolio and enable continuous improvement of its product quality.
Read more...
Filters for zero-alcohol wine
Parker Hannifin - Sales Company South Africa
Analytical Instrumentation & Environmental Monitoring
The market for zero-alcohol wine is creating fresh opportunities for wine producers, but processing these products creates new contamination challenges. Technical support from an established filtration specialist, such as Parker, can help wineries in overcoming the challenges posed by the increased risk of contamination.
Read more...
Remote monitoring solution for sewage plants
ifm - South Africa
Analytical Instrumentation & Environmental Monitoring
With ifm’s remote monitoring solution, you can visualise the condition of the submersible pumps in your sewage plant and diagnose issues before they become serious problems.
Read more...


 printer friendly version