

Almost every plant has motors performing work. Motors and the related mechanical systems are a major area of maintenance cost for plants. National Instruments tools can be used to lower the cost of maintenance and prolong the life of existing equipment.
Facilities managers, maintenance managers, plant engineers and operations managers are responsible for all types of equipment. Machines involved in maintenance programmes include pumps, fans, conveyors, lifts, grinders, classifiers, rollers, winders, compressors, choppers, mixers, palletisers, cooling towers, vacuum systems, HVAC systems, and so forth. Each of these machines may be critical to the operation of the plant. The breakdown of critical machines causes loss of revenue for the plant.
Historically, technicians and engineers have used portable testing tools to monitor machine and motor health. Today's technologies in the personal computer and in instrumentation available for the computer have brought the costs of permanent continuous measurements down to justifiable levels. In addition, more and more plants are interested in providing machine health information directly to the operator at the HMI/scada workstation.
Most vendors of machine health monitoring equipment focus only on vibration sensors. This focus limits their ability to include other sensors such as temperature, pressure, flow, and electrical power measurements in their health analysis. In addition, traditional tools are not able to communicate directly to existing equipment on the factory floor. National Instruments' platform, LabVIEW and PXI, have all of these machine health monitoring and analysis capabilities plus the extended abilities of HMI/scada, I/O for many other sensors, and interconnections with existing plant equipment such as PLCs and scada systems.
Some readers may have made use of National Instruments products for high-speed data acquisition, HMI/scada, or odd-job measurements in the past. It is now possible to purchase one integrated platform for all of the needs of a plant. This article describes National Instruments'capabilities in the area of machine health monitoring.
Machine condition monitoring
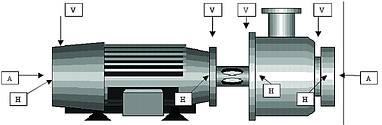
Most machine monitoring applications focus attention on vibration (displacement, velocity, or acceleration) transducers to monitor vibration from key locations on rotating machines. Typically, the sensors are mounted above bearing housings for predictive bearing failure analysis and shaft balancing information. Figure 1 shows an electrical motor with pump commonly used in pipeline applications. This example also applies to other electrical motors with loads. The arrows below show typical vibration sensor locations. Vertical (V) and horizontal (H) sensors are mounted at 90° angles for bearing monitoring. Axial sensors are mounted at either end of the drive train to monitor axial movement.
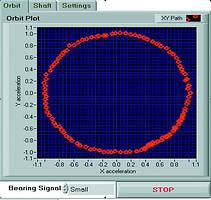
By looking at the horizontal and vertical sensors, it is possible to see the movement of the shaft in the x-y direction. This movement is displayed on an orbit plot as shown below. The orbit plot shows the path of the centre of mass of the shaft. A perfectly balanced (ideal) shaft (motor and load) will appear as a 'dot' in the centre of the plot. Normal operation always produces some shaft motion. By monitoring and analysing this motion, it is possible to detect changes or trends that can flag the need for maintenance and also assist in problem diagnosis and balancing. National Instruments LabVIEW software provides extensive plotting and analysis capabilities that are ideally suited for display and analysis of vibration information.
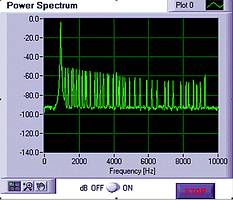
Orbit plots - such as the one illustrated - depict signal changes as a function of time. The frequency-domain version of this signal-the vibration spectrum-also provides much useful information. The plot in Figure 2 shows a power spectrum of a signal that is characteristic of what one might see from a digitised signal from a vibration transducer. The process of creating such a plot is straightforward. Some care must be taken during acquisition. Because the vibration signal is dynamic (rapidly changing in time), it is important to apply an anti-aliasing filter prior to digitisation. Dynamic range and a variety of gains are also important, because the level of such signals can vary widely. Following acquisition, the time domain samples are transformed into vibration spectra by applying an FFT-based algorithm running on the computer. By examining the spectra, one can see the amplitudes and phases of the vibration components as a function of frequency.
By recognising the frequency bins associated with the speed of the machine, one can estimate the forcing functions - the probable source of the vibrations. For example, imbalance typically causes a change in the vibration component associated with the same frequency as the rotational speed of the machine. Vibrations at twice the speed of the machine are typically due to mechanical looseness of the motor or load. Other common vibration sources include oil in sleeve bearings, rolling element bearings, gear teeth, and electrically induced vibrations from electrical motor rotor and stators. Each of these vibrations occurs at a known frequency in comparison to rotational speed of the system.
Trending
Trending involves watching vibration levels over time and noting patterns in these levels. By monitoring the vibration levels over time, you can see changes in vibration level from a particular source. For example, if more vibration occurs over time from the motor's drive end bearings, a reasonable conclusion is the machine is nearing the need for bearing replacement. By comparing the vibration levels of the bearings to the specifications of the manufacturer, it is possible to gauge the condition of the bearing and how soon it will require maintenance.
One challenge with machine health monitoring is that each vibration (or velocity or displacement) sensor will report vibration from all sources. While the vibration spectrum helps review the vibration level from each source, it becomes helpful to decode the time series data into independent vibration source data streams. In machine speak; a multiple of machine speed is called an order. With sophisticated analysis routines from the National Instruments sound and vibration tools, LabVIEW is able to extract the vibration source information or order information. This further helps to monitor and trend the vibration signal from each source.
A common visual trending tool is the waterfall plot. This display tool shows the movement of spectral data over time. It is a common trending tool used to see the increase in vibration amplitudes and to see the appearance of resulting vibrations.
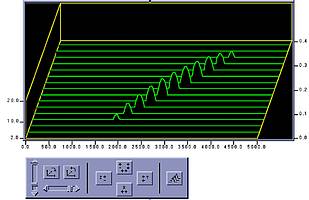
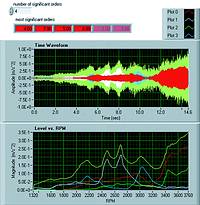
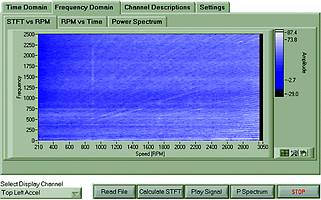
A more complete picture of vibration trends can be displayed with the Lab-VIEW intensity chart. Three parameters are displayed in the same chart, machine speed, vibration frequency (FFT) and amplitude. The amplitude of vibration is displayed with colour. In the display shown, it is possible to see each order or vibration source in the bands originating from the zero axis of the chart. An optional cursor slices through the data to produce a more complete spectrum at a particular speed or time.
Historical trending
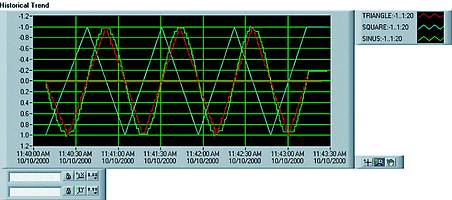
A more common trend display is a 2D historical trend. This trend shows values as they change over time. These trend lines are not limited to vibration data, yet can also display digital status information as well as other physical data such as pressure, flow, and temperature. These additional factors further help to identify the state and condition of the machine.
National Instruments
(011) 805 8194
The second part of this article will begin by looking at electrical power condition monitoring.


© Technews Publishing (Pty) Ltd | All Rights Reserved
 printer friendly version