


Today, in every aspect of our lives but more particularly in the industrial IT world, Big Data is all the rage. The old ‘KB’ has been turned into the new ‘GB’ – Microsoft’s original and (now) laughable limit of 640K memory has now been turned into the run-of-the-mill 640 Gigabyte hard drive. And while ‘GB’ is morphing into ‘TB’, just around the corner is the ‘EB’ – the Exabyte (1 EB = 1billion Gigabytes) – if you wanted Big Data, you got it. But now what?
While today’s industrial automation and information technology is geared to produce more data than ever before, what does it all mean? Data only becomes useful if it can be turned into information and then into actionable knowledge – so it could be said that more data is only useful if it leads to more wisdom.
Turning big data into actionable knowledge
The world of industrial automation generates more data faster than any other. It’s all happening in real-time down to the millisecond. Most of these data simply show that things are operating normally, but others may indicate that potentially dangerous trends are emerging while the remainder are cause for immediate concern. But how do you tell? Data isn’t information, yet companies run on information so the conversion from one to the other is an important aspect of effective decision making. Data only becomes information after they are collected, validated and collated within the context of the situation and environment in which they originated.
Any production environment generates a variety of data from many different sources. Some are stored together in the same database (e.g. process control data in a real-time database) while others are stored elsewhere (e.g. LIMS, MOM, etc.). Of necessity, these varied databases will be structurally different from one another. Also, they will have been designed to address specific issues and probably in isolation of one another and of the bigger enterprise-wide business picture.
Figure 1 shows the process of transforming data into knowledge – note the all-important central block of contextualisation. Context can be described as the additional data or information pertaining to the conditions and circumstances under which a measurement was made. For example, knowing that the night shift exceeded the production of the day shift may well be due to their motivated approach but it could also be due to the fact that they had eight uninterrupted hours of electricity, quality raw material with which to work, high machine availability (which may mean that they look after plant machinery better than their colleagues), etc., etc. A single datum on its own has value but never as much as when viewed in relation to other events that influenced it. This may mean digging in other data repositories in order to collate it all.
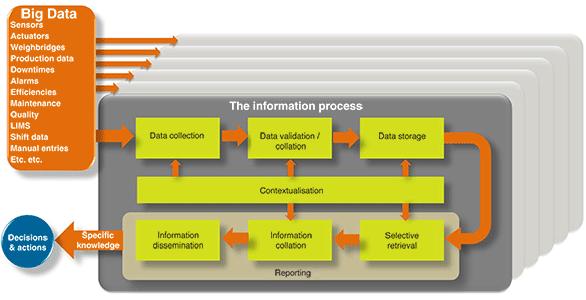
The information process is replicated and applied to each item or each group of the data sources showing that enterprise information is complex and multi-dimensional in nature – imagine the information process ‘stacked’ six or seven layers deep as shown. And that’s where things get interesting.
The dynamic and multi-dimensional nature of information
Different people need to know different things at different times. Operators, supervisors and maintenance personnel need to know a great deal more about the details of operational processes (and in real-time) than corporate operations management. Yet what both groups need to know is often derived from the same data or groups of data which is, thankfully, finite (although mind-bogglingly large).
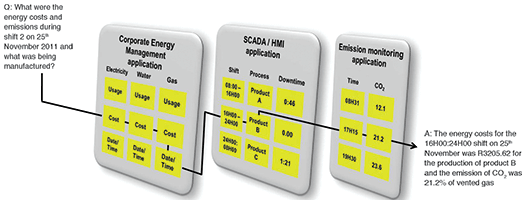
The Structured Query Language (SQL) used for retrieving data from relational databases is still the standard for individual, application-specific databases. But when we get to the situation where the relevant information is spread across several of these databases, things become more complex – not because of the technology involved to do this but because of the nature of the information required which is often unknown before it is required. So what we need is a super SQL that can cut across database boundaries yet provide the friendly interaction necessary for multiple views (depending on your needs) into a seemingly seamless pool of factual information so that you can make the right moves – oh yes – and it’s all got to be time-stamped for correlation purposes.
So where to from here?
Reporting software is available but to do the above is going to require the services of an expert (who will most probably not fully understand the needs of the end-user). Another avenue is the use of spreadsheets but who’s going to maintain them? On the other hand, Flow Software allows the average individual to connect to the real-time historian as well as other databases, aggregate data (e.g. daily/weekly reports), perform calculations (e.g. efficiency of production processes by area or shift, energy consumption, machine efficiency, etc,), enter manual data and correct / validate existing data before using one of the standard reports supplied to provide the required information – all through drag-and-drop easiness. What’s more, Flow is designed to cater for the easy and frequent report changes necessary for analyses.
About Flow software
Flow is a configuration-based calculation and reporting engine that integrates directly into and extends various data sources such as Wonderware Historian, Microsoft SQL, OPCHDA and others. Measurements are taken from points of interest that are configured in the Flow system which automatically retrieves and aggregates data from the underlying data sources. Calculations, manual data entry, limits, reports and forms are configured in a drag ’n drop manner.
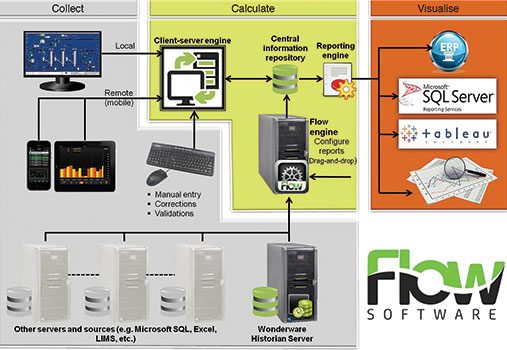
With its simple configuration environment, Flow promises an ease of use that even business users will adopt, moving the system ownership to end users and lowering the total cost of ownership. Flow is typically used as a production or manufacturing performance management system. Because it is able to connect to and automatically collect data from multiple systems, Flow is an ideal system for centralised reporting and data analysis and a number of prominent South African companies have adopted Flow Software as their information tool of choice. There are three phases to the Flow information delivery process; collect, calculate and visualise:
• Collect – Flow collects information from multiple data sources automatically and understands historians, databases, text files and even on-line data stores. Information can also be entered manually. This all contributes to keeping all the necessary information in one place and maintaining a single version of the truth.
• Calculate – Flow provides for the aggregation of information for time periods ranging from hours to days, weeks or even months. Flow’s calculation engine allows for the evaluation of KPIs, ratios and efficiencies. Flow also provides for the addition of the all-important context to information (e.g. batch numbers, products, operators) which all contributes to a far better informed evaluation of performance against targets.
• Visualise – The single Flow repository is the source for all reporting. Pre-aggregated and pre-calculated information enhances the performance of reporting as well as increasing business intelligence. It’s also possible to integrate Flow information into other applications such as Wonderware Skelta BPM (workflow management), ERP, etc.
Conclusion
For more than two decades, anyone involved with industrial automation has been after the Holy Grail of profitability – information. That’s because it lets you know when you’re doing the right thing and alerts you when you’re not. But the diversity of the production environment with its multitude of voluminous data sources has always required computer experts to make sense of it all. Computer experts, though, are not usually experts in what a particular company needs to know – the company’s staff and management, on the other hand, are. With Flow software, they have a tool that puts them in the driving seat by easily cutting through the difficulties of sourcing data from a multitude of sources and also lets them cross traditional information boundaries to get to the decision-support knowledge they need.
So, you no longer have to be a genius to make business sense from an avalanche of industrial IT data. You do, however, still need to retain your genius status regarding what to do next – but even there, help is on the way.
For more information contact Jaco Markwat, Wonderware Southern Africa, +27 (0)11 607 8100, jaco.markwat@wonderware.co.za, www.flow-software.com






© Technews Publishing (Pty) Ltd | All Rights Reserved
 printer friendly version