The power quality survey is the first, and perhaps most important, step to identifying and solving power problems.
Power problems can harm equipment performance and reduce reliability, lower productivity and profitability and even pose personnel safety hazards if left uncorrected. However, the power quality survey is an organised, systematic way to solve them. Whether the investigation involves a single piece of equipment or the facility's entire electrical system, the survey process requires the following five basic steps:
* Planning and preparing the survey.
* Inspecting the site.
* Monitoring the power.
* Analysing the monitoring and inspection data.
* Applying corrective solutions.
Planning and preparing the survey
Like any good investigative reporter trying to get to the 'bottom of the story,' the process basically involves finding out the what, where, when, how and why of the power-related problem(s) at hand. Defining objectives not only keeps the project in focus but also helps in identifying the specific equipment resources needed to get the job done.
Where to monitor depends on where the problems are detected or suspected. If the problem is localised to one piece of equipment, start with a monitor at the connection point where the equipment is powered. If the equipment is not faulty you can work backwards to the point of common coupling (PCC). Sometimes, as noted in the IEEE Std 1100-1992 (Emerald Book), 'Electronic equipment can be both a contributor to and a victim of powering and grounding incompatibilities in the power system.' Conversely, if the entire facility is affected, or if you want to conduct a baseline survey to determine the quality of the supply from the electric utility, starting at the PCC is the logical choice. You can then work through each feeder circuit to specific loads.
The time when the problem occurs can also provide important clues about the nature of the power problem. If the problem only occurs at a certain time of day, the equipment switched on at that time should be suspect. The monitoring period should last at least as long as one 'business cycle,' which is how long it takes for the process in the facility to repeat itself. Some processes run identically for three shifts, seven days a week. Other operations are different each day of the week and should be monitored for a minimum period of one week.
As part of the planning and preparation process it is necessary to obtain a site history for the facility or equipment being investigated. Questioning equipment operators or others familiar with operations is an important part of a site history. Typical site data of interest would include determining the time - both occurrence and duration - of recurrent system problems, recording failure symptoms or hardware failures, noting any recent equipment changes/additions or facility renovations and logging the operating cycles of major electrical equipment in the facility.
The basic tools for the power quality survey are the power quality monitor, circuit tester, multimeter and an infrared scanner. Other useful tools include clamp-on (Hall Effect) current probes, video camera, tape recorder, ground resistance meter and insulation tester. Not all of these tools are necessary for every survey, but the power monitor is the mainstay.
Power monitors of widely diverse functionality are available for documenting the electrical conditions encountered during the physical inspection and to gather and store data for later analysis. Some power quality monitors can be permanently installed at a remote site to provide continuous monitoring of the electrical system. Information can be downloaded to a portable monitor, downloaded to a PC or retrieved on site. High-speed and modem communications allow facility, intranet or Internet monitoring. Smaller, handheld devices are also available that afford users an impressive array of parameters and capabilities, while at the same time simplifying measurements and saving monitoring time.
For example, some power quality monitors require only one reading for simultaneous capture of all three phases instead of four individual readings. In addition, three-phase calculations are made automatically by the instrument. Some instruments, like the PQPager, developed in conjunction with the Electric Power Research Institute (EPRI) and major electrical utilities, were designed with proactive power quality programs in mind. This instrument can make up to four analog/cellphone calls, leave its phone number on alphanumeric pagers and provide a voice-synthesised report of power events.
The more sophisticated power quality monitors can turn data into information, but turning the information into answers is often an iterative process, not unlike an archaeological dig with each layer uncovering hidden problems. The process is then repeated until the system operates satisfactorily. What is important is that the quality of supply is compatible with the requirements of the equipment empowered by it.
Inspecting the site
The site examination begins by visually inspecting the facility exterior and around the immediate vicinity in order to gain a better perspective of the utility service area. Features to look for include the type of electrical service (for example underground), utility power factor correction capacitor installations, neighbouring facilities, which might be back-feeding interference onto a shared utility feeder, nearby substations and other potentially problematic conditions.
Inspecting the facility helps to identify equipment that might cause interference. Electrical distribution system problems such as broken or corroded conduits, hot or noisy transformers, poorly fitted electrical panel covers and more can be detected. Major electrical loads such as large photocopiers, UPS systems, air compressors, and so forth, should be reviewed. Special attention should be given to loads near troubled equipment.
Any inspection should include a physical review of the wiring from the critical load to the electrical service entrance and identification of any loads, which might cause power problems. All necessary safety precautions should be observed and only qualified personnel should perform any required testing and maintenance work.
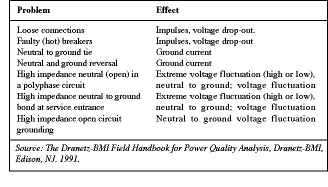
As Table 1 shows, common wiring problems are a frequent cause of power quality problems. Loose connections and other discrepancies noted during inspection of the electrical distribution system should be corrected prior to monitoring. Special attention should be paid to equipment power cords and plugs, receptacles, under carpet wiring, electrical panel boards, electrical conduits, transformers and the electrical service entrance.

Monitoring the power
The power monitors should be placed at the locations decided during the planning and inspection activities. In general, to determine the overall power quality of the facility, place the monitor at the service entrance. To solve a power problem for a single unit of equipment, place the monitor as close as possible to the load. To look for a power quality problem, monitor the voltage; to find the cause, monitor both voltage and current. The three-step monitoring process involves:
* Using the instrument's scope mode to see voltage and current magnitudes and wave shapes.
* Using the time interval setting to record background events.
* Using the limits and sensitivity thresholds setting to record any disturbances or events that may affect the equipment or process being monitored.
Periodically checking the captured data allows the user to 'tweak' the thresholds to capture only those events that are critical to the equipment's performance.
Analysing the monitoring and inspection data
To identify equipment problems, it is important to analyse data in a systematic manner. First, check for power events that occurred during intervals of equipment malfunction. Next, identify power events that exceed performance parameters for the affected equipment. Also, review power monitor data to identify unusual or severe events. Finally, correlate problems found during the physical inspection with equipment symptoms. A number of additional procedures must also be performed, including:
* Review all inspection records, site data and equipment event logs to plot key event summaries.
* Compare power events to equipment event logs and performance specs.
* Extract key power monitor events, which may cause equipment malfunction.
* Classify key power monitor events into groups to simplify analysis.
* Correlate and validate power monitor events with equipment symptoms.
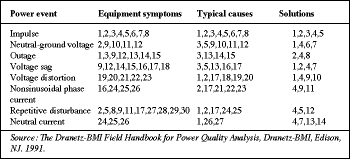
* Identify cause in terms of voltage sag, ground or neutral event, transient or voltage distortion (Table 2).

Applying corrective solutions
Adding new wiring, special filters or moving an interference source to a different circuit can solve the problem. However, a more proactive approach is to permanently install networked monitors at the PCC, each distribution panel and each critical load. Monitoring the system this way produces a more complete, continuous picture of the entire system's performance. The characterisation and statistical indices for power quality provide a basis for the user to determine what is 'normal.' It can also bring to the user's attention any degrading performance of a part of the system (eg failure of an output stage of a UPS) before it harms productivity. The data collected can be compared against baseline surveys, such as the results from the EPRI Distribution Power Quality project or the NPL point-of-utilisation survey, to see how the facility compares statistically to other systems.
Observe the rules
There are five simple rules to remember while performing a power quality survey:
* Apply the 'test of reasonableness' to all data and information. Basic laws of physics cannot be temporarily repealed to make something believable.
* Know the performance as well as the safety limitations of monitoring and test equipment.
* Look for the obvious. Most power problems are solved like peeling onions - one layer at a time.
* Do not fall victim to 'paralysis by analysis.' Set reasonable monitor thresholds, concentrate on the larger events and then work your way down.
* Start with the simple things first. Power problems are often caused by nothing more mysterious than loose wiring connections.
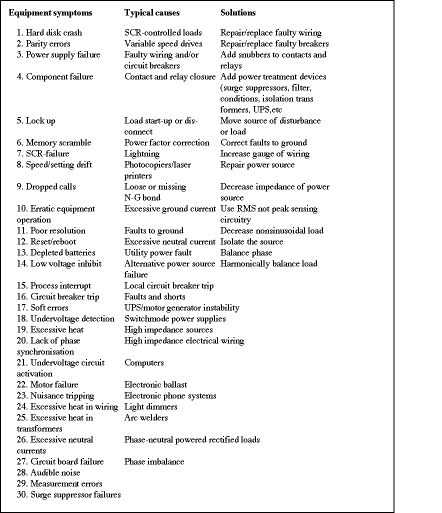
To find the symptoms, causes and solutions for the various power events in the upper left column, match the adjacent code numbers to the corresponding descriptions in the lower half of the chart.


© Technews Publishing (Pty) Ltd | All Rights Reserved